December 13, 2013 2:54 pm
Written by Ellie Wilding
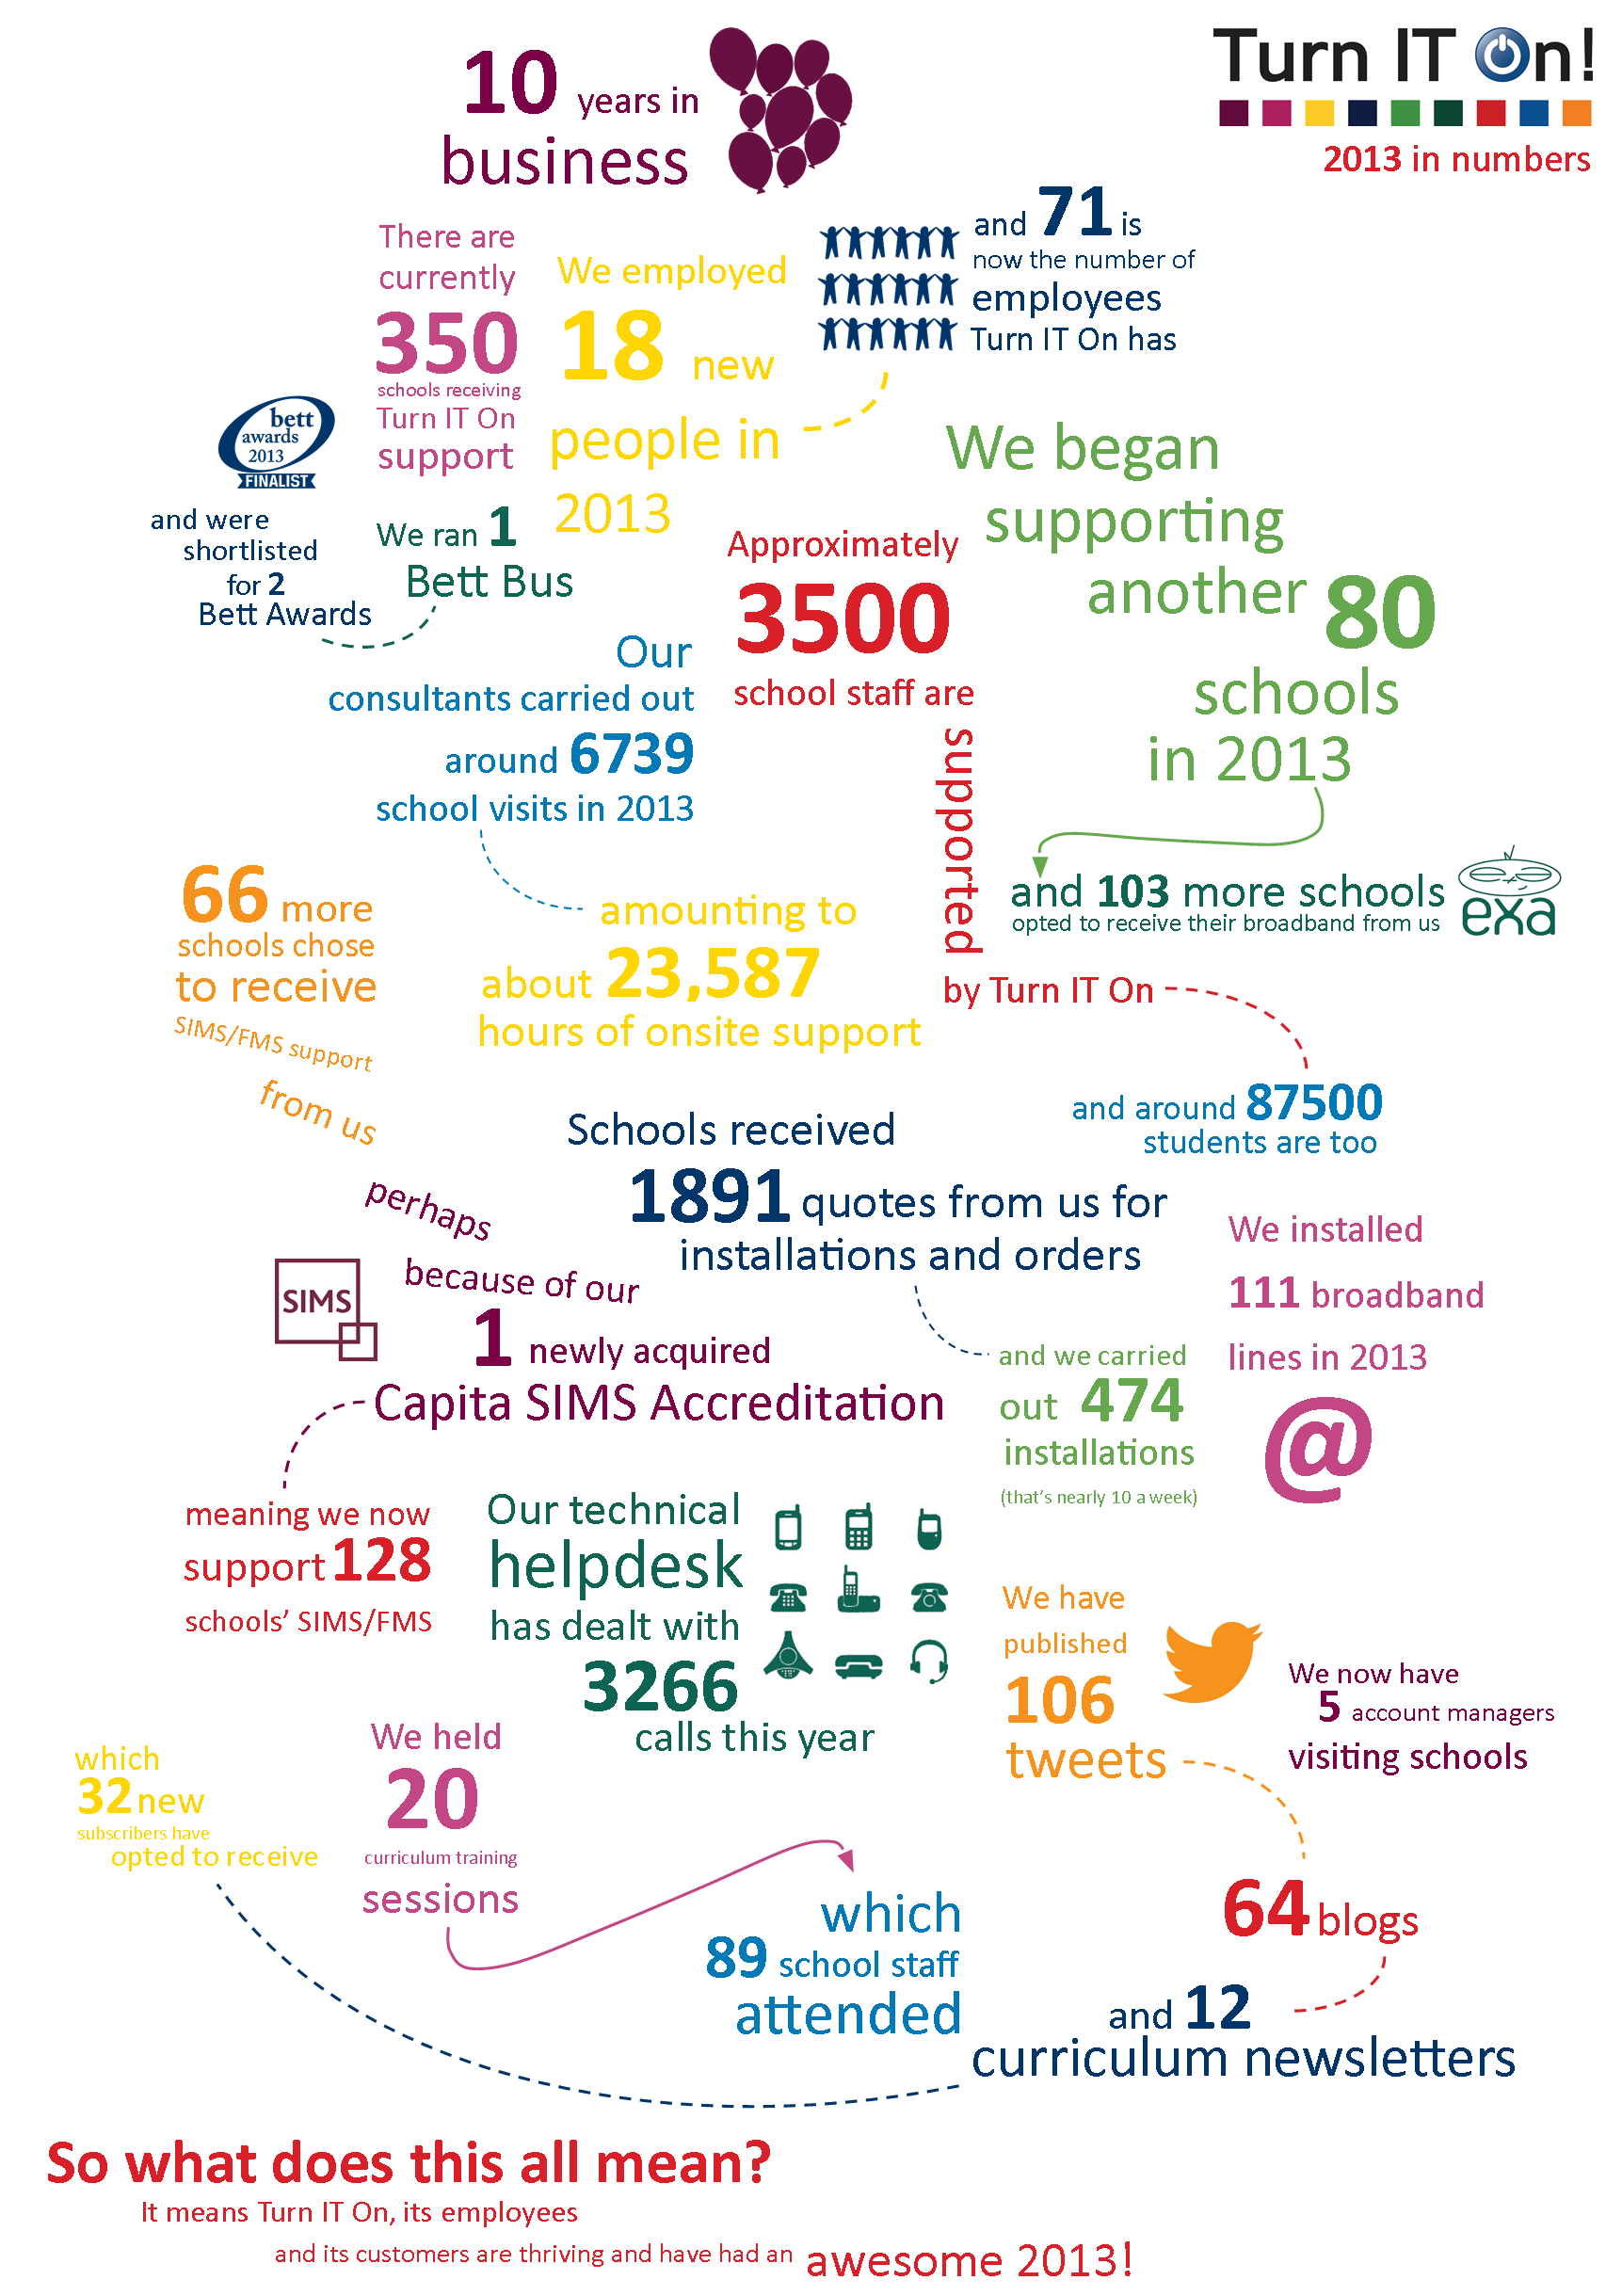
Turn IT on’s 2013 in numbers
Take a look at the infographic below (or download here) we have put together charting Turn IT On’s 2013 in numbers.
It’s been great to reflect on our achievements and milestones over the past 12 months and it’s fun to see it all on one image!
Why not do something similar for your class, or even the whole school? It works particularly well if, like us, you’ve celebrated an anniversary in 2013 (Turn IT On turned 10 this year). If you do create your own infographic, please do send it over and we’ll publish it on our blog!