January 15, 2014 10:03 am
Written by Ellie Wilding
Create infographics in lessons
You might remember our post in December which documented Turn IT On’s 2013 in numbers by way of an infographic:
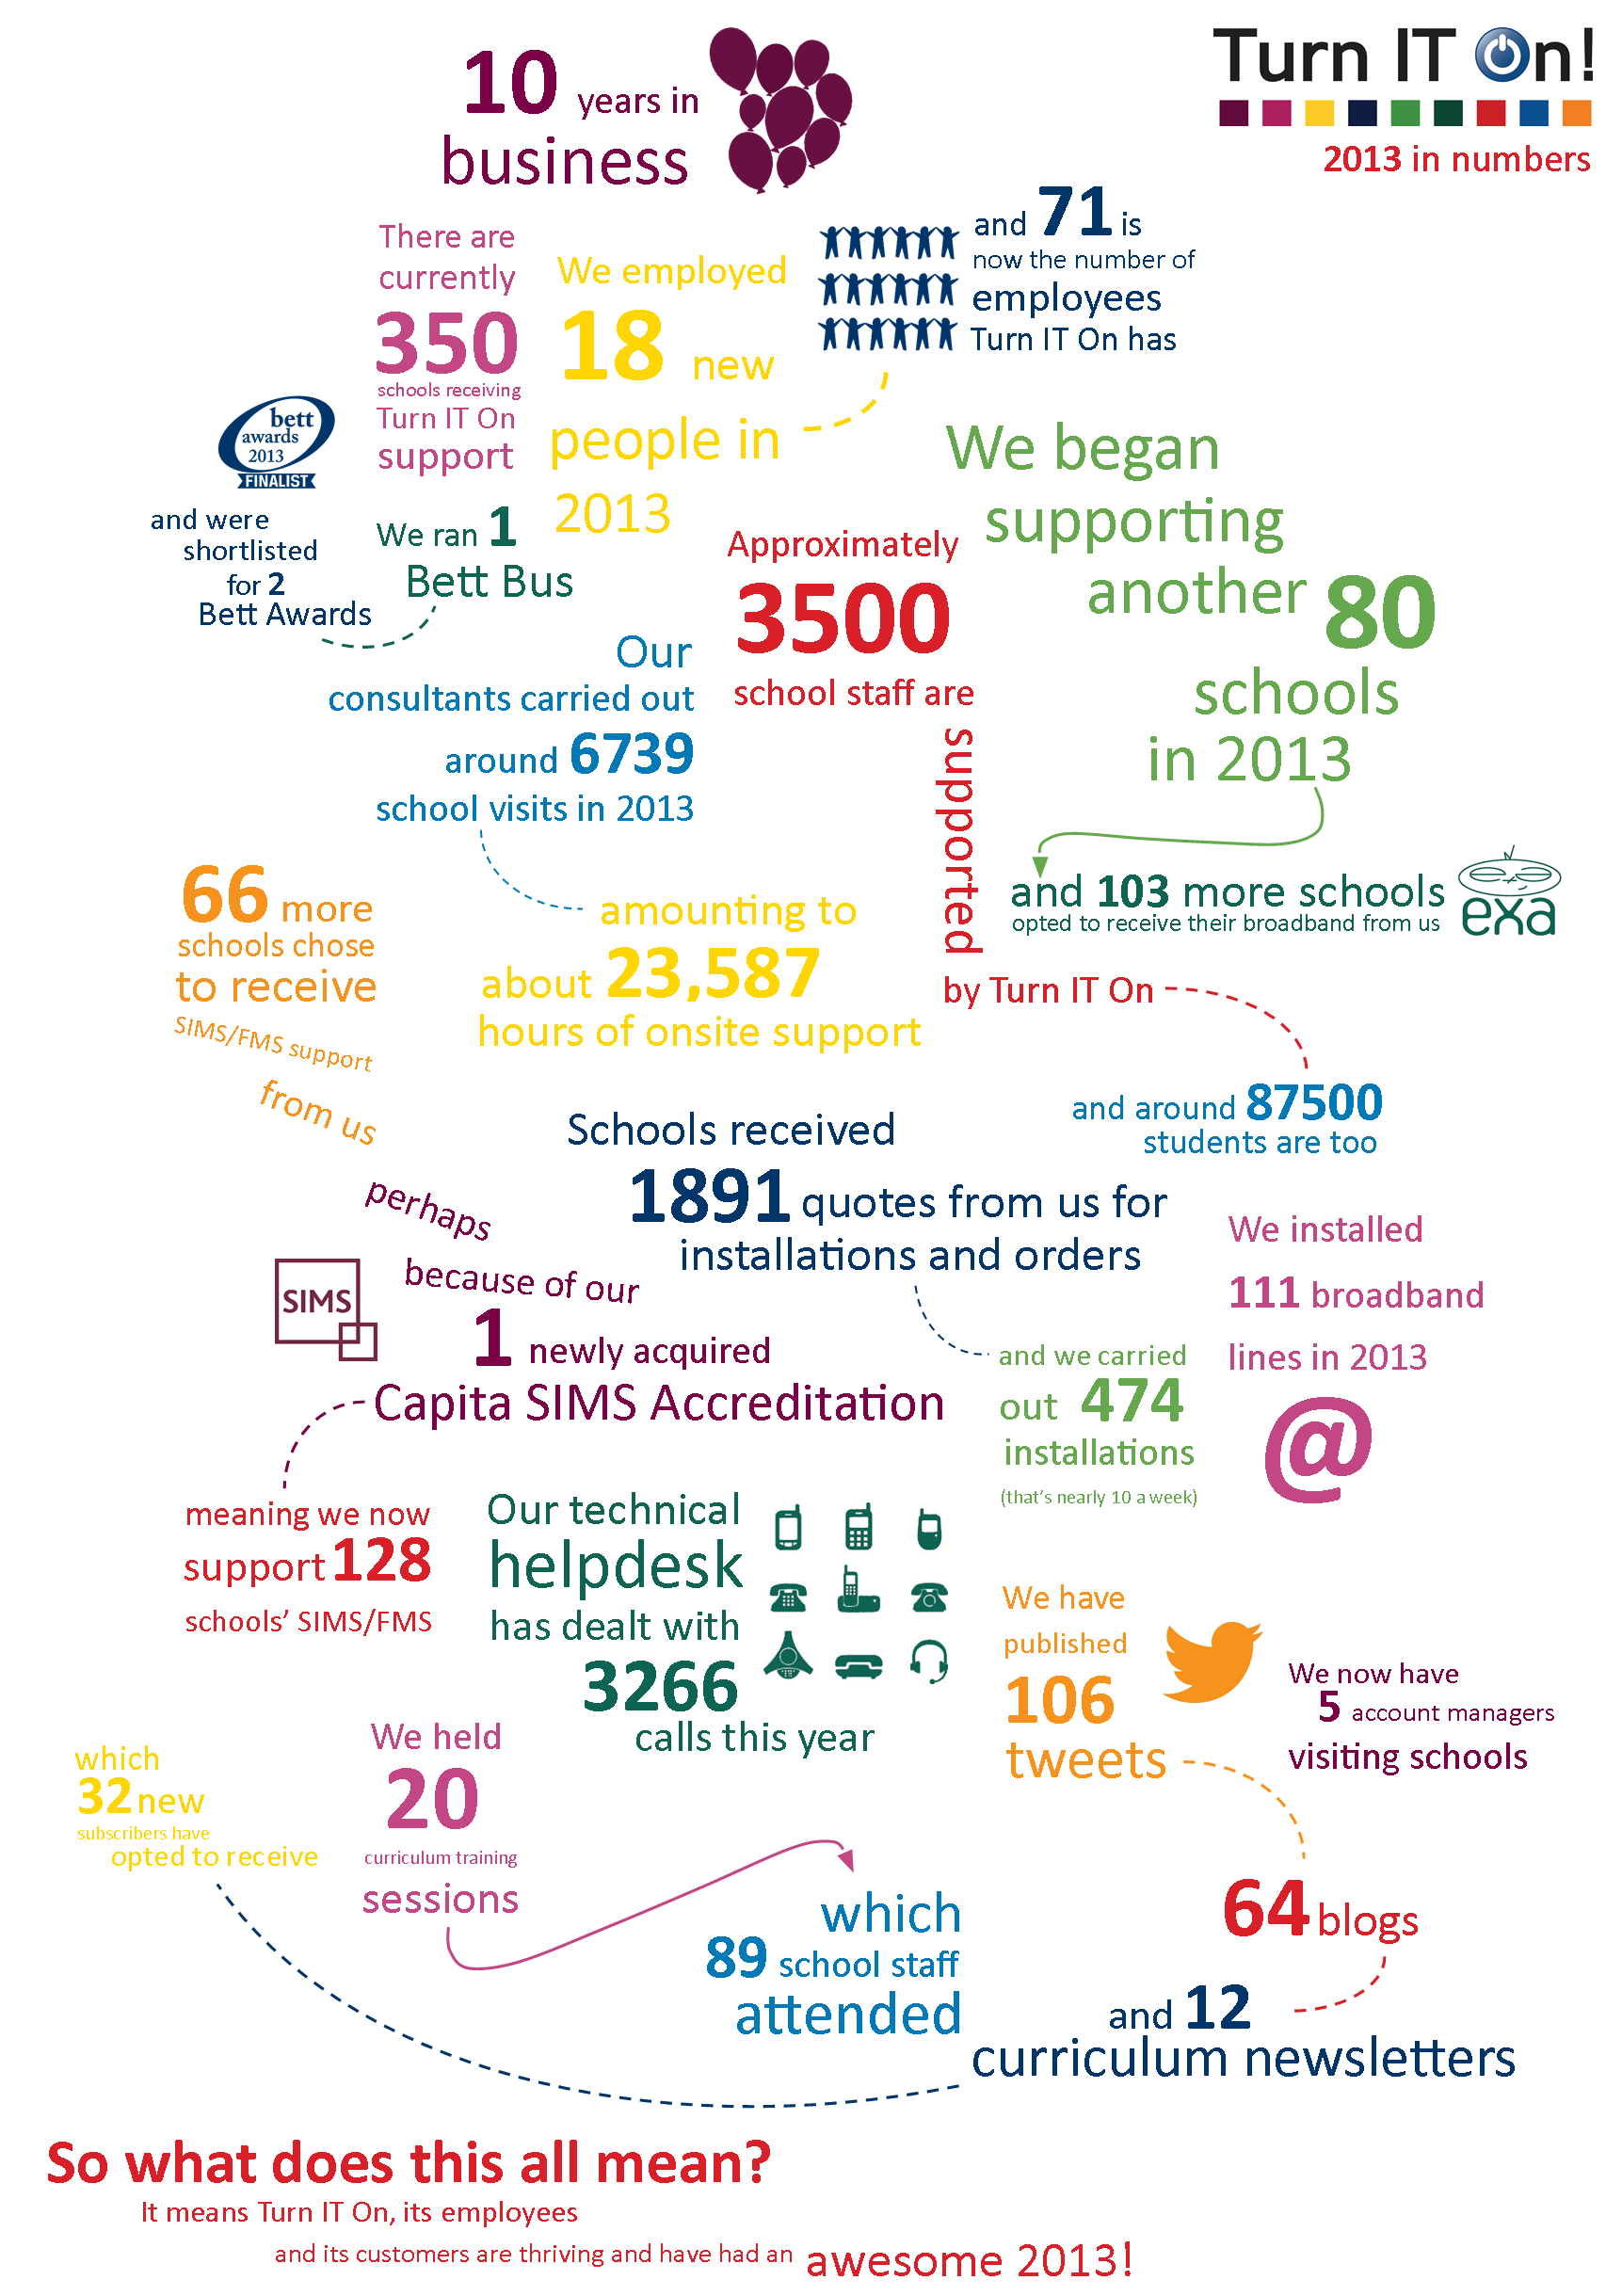
Infographics are a great way of making statistics and otherwise dry information more visually appealing and easy to digest. Ever since then we’ve had lots of teachers expressing interest in creating something similar in their lessons. Our infographic was created from scratch in Photoshop, but there are free online infographic makers which make the process much simpler!
Two examples of such online programs are:
You can choose a template, enter your information and create a beautiful graphic without the fuss.
wordle.net is similar and always fun – its online tool allows you to create clouds of words from a list of text. This is the one we created with all the Turn IT On staff’s names: